From time to time it comes the day where we have to test how an application behaves in terms of memory on heavy load. We might be chasing a memory leak or tuning some caching logic or just making a report about the way an application uses memory. There are a lot of tools on the market that help doing these kind of tests. At this moment I use AQtime from AutomatedQA.
Nevertheless there are plenty of reasons to know an learn how to use the basic tools. One good reason is that you will never get those IT guys to install these advanced tools on a productive server :). The other is that these tools work at a higher level of abstraction, they hide the internals and therefore are bad for learning. Once you know to do things the dirty old way you will love the time savings you get if you can just turn on your performance testing suite and get all the data you want with a couple of clicks.
I encourage everyone to learn with the basics and them get the benefits (time) of using a performance test suite.
In my case it was a web application at Primavera that was needing some tuning in terms of memory.
Setting Performance Counters
When I am looking at memory optimization or at finding memory related bugs these are the most common counters I use:
- \.NET CLR Memory(w3wp)\*
- \W3SVC_W3WP(application pool)\Active Requests
- \W3SVC_W3WP(application pool)\Active Threads Count
- \W3SVC_W3WP(application pool)\Current File Cache Memory Usage
- \W3SVC_W3WP(application pool)\Requests / Sec
- \.NET CLR Memory(w3wp)\Large Object Heap size
- \Memory\% Committed Bytes In Use
- \Memory\Committed Bytes
- ASP.NET Apps v2.0.50727/Cache Total Entries
To set these up use the Performance and Reliability Monitor:
Them create a new data collector set:
Choose to create manually and them next:
Choose to store the performance counter data and then next:
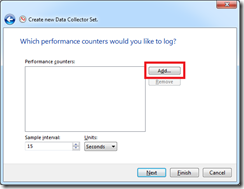
Choose the required counters by pressing Add:
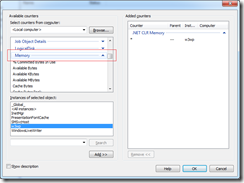
Choose the .NET CLR Memory group (selects all the counters inside) and choose the w3wp process (if it is not running start it by browsing to one of the site pages.):
The add the Memory counters:
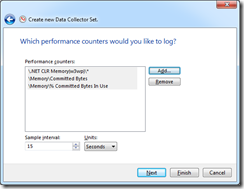
In this case I typically do not add the group but only the two mentioned ones:
Done adding counters them press ok and it returns to the wizzard:
After pressing next we can choose where to store the files:
And the last wizard page allows us to change the user running the collection:
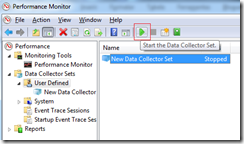
Now we have to start collecting data:
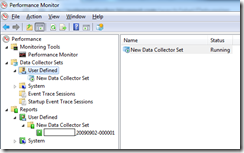
And notice that a report is created to show the collection results:
The actual results are only shown when the collection is stopped. It can be started and stopped and in each time a new report is created.
What do you get out of performance counting
There are no receipts off what is the chart that will guide you to find the problem. You have to put your detective hat on and start following you intuition :). But here are some examples of charts that can mean something about what is making your application misbehave.
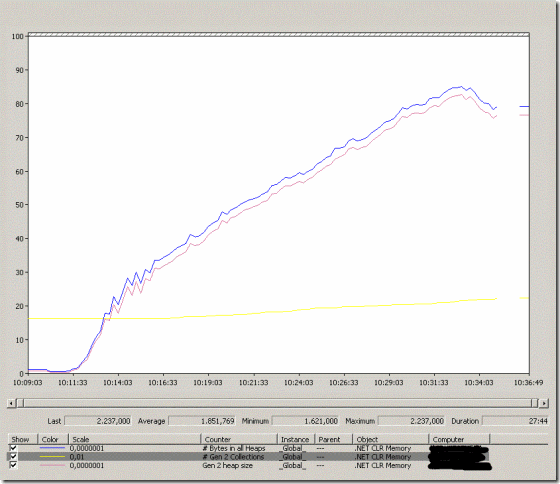
In this application the memory footprint was increasing a lot and we where suspecting a memory leak. But after some time the memory entered a constant average. This was under heavy load using a stress testing tool. On the chart I am ploting the GC2 heap, the GC 2 heap collections and bytes on all heaps.
It is easy to see that GC2 is what is causing the memory increase. The blue line (bytes in all heaps) is following the pink one (GC 2) GC collections are running normally and so all these objects must be rooted some how.
I attached WinDbg to the process and checked the roots of a couple of random objects. In this case Web UI objects. They where being rooted by the Cache System. So I added a couple of more counters.
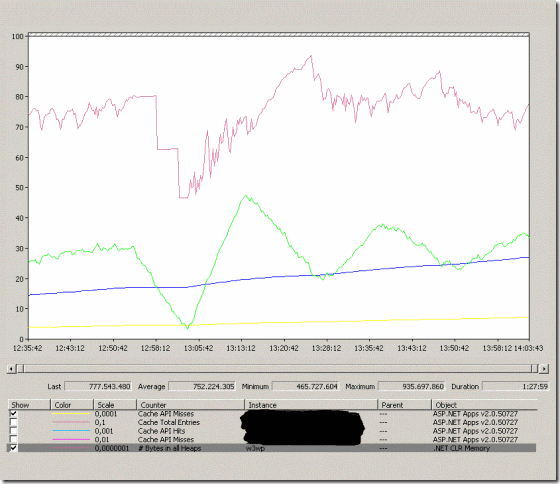
In this chart we can see the evolution of cache entries, the number of hits and misses. We can see the the increase in memory tends to follow the increase of cache entries and as time passes and memory enters a stable value the number of hits increases. At this time most of the possible pages are already in cache. Also the old pages are dying and being replaced by new ones and this is why memory is increasing and decreasing in small deltas.
This application was using a lot of memory because it was adding items to Cache with the CacheItemPriority.NotRemovable option and with a big expiration time. The server was having an hard time getting rid of all those items in the cache in the first minutes. Them some of them started to die and memory was being reclaimed.
Tuning the performance
Recomendation 1 - Strings
One good thing to look at is how much memory strings are using. Some applications tend to abuse on string concatenation and that fills the memory with intermediate results. Every + or & operator creates a new string in memory. So if you are adding 4 strings together to get the final result you created three unneeded instances. The alternative to that is using the StringBuilder object.
Recommendation 2 – Stored Procedures
Some applications also construct sql code for operations by formatting strings or concatenating them together. Besides paying the penalty of not having compiled optimized sql statements they are also adding pressure to the GC because they are creating string objects all the time. Whenever possible use stored procedures.
Recommendation 3 – Caching has side effects
At a first impression caching is always good. What is best, to always compute a new page or to return a page that is already there? Most people would answer caching. Well the correct answer is a little bit more complicated. In principle caching is good but one must level caching and memory efficiency. If the memory of a server gets to low it will have problems creating replies event if most of the stuff that has to rendered is in cache. Each page that has to be output always needs some amount of memory to be served and if that memory is low then GC has to cleanup stuff and the server will serve less requests.
So when it comes to caching I would say that it should be configurable, CacheItemPriority.NotRemovable should be used in special cases and most of times we should let the caching algorithms work out what should be taken out of memory. Also a application that creates a lot of memory pressure should use the priority levels correctly and not place everything with the same priority. Structures that are shared by everyone and have a higher probability of being reused should be a higher level of priority.
Recommendation 4 – Session and Context
Web applications are very special in terms of session and context. When you are designing something that is hosted on the client and using its resources you have the memory of that client to store your stuff. But at the server the same amount of memory has to be shared by the 10000 users of the server.
The first bad idea is trying to give the users the same experience on the web as they have on desktop. Web applications should be as contextless and as sessionless as possible. The worst thing you can do to your costumers is adding memory pressure to the server. There are alternatives to store things in memory being one of them storing them in a data server. That same data can them be cached. It is true that it is still using memory but it is memory that can be reclaimed if needed.
Recommendation 5 – Study how the users interact with the applications and build on an architecture that can be tuned.
Most decisions here have a lot to do with the way the users interact with the application. With this knowledge one can choose stress tests and load tests that are closer to the way the users push the application. This will naturally lead to better tuning.
Conclusion
When it comes to performance the only process that can lead to good results is performance and stress testing. These tests have to be done from day one because they can lead to architecture changes. This is not the case with most development processes. Most teams tend to do these tests when the product is already in a advanced stage and changes are hard to do.
It is important to note that testing and tuning are different things. Testing is about making sure that the product is still within acceptable behavior. I find that optimization works out best on a later stage. One should only go and change the architecture and code if on testing the behavior is below the requirements.






No comments:
Post a Comment