Setup the environment
Download and install windows debugging tools: http://www.microsoft.com/whdc/devtools/debugging/default.mspx
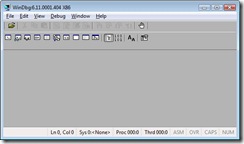
Run windbg:
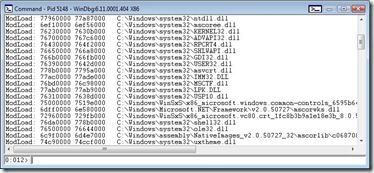
Press F6 (or File-> Attach to process) and select the process. You should see a new window with the list of dlls used by the process:
Windbg is a native debugger and is not aware of .NET CLR objects. But it is also an extensible debugger and it is possible to make him aware by loading some extensions. The one we are interested in is SOS. This is done by typing:
.loadby sos mscorwks
The command tells windbg to load sos.dll from the same directory as mscorwks.dll.
Next comes setting up the symbol files location. First the symbols of Microsoft dlls:
.sympath SRV*c:\wheretostorethefiles*http://msdl.microsoft.com/download/symbols
Next adding the symbols for the product under debug:
.sympath+ c:\LocationOfTheProgramFiles
You should see both paths at the output of the debug window.
Now we have to let our application run until the point where we want to analyze the leak. So hit F5.
Main Commands
- !finalizequeue –> Output the list of objects in the finalization queue.
- !address –summary –> Output a resume of the memory usage in the process.
- !eeheap –gc –> Output a resume of the memory used by the internal clr structures.
- !dumpheap –stat –> Output how many instances per type are in the heap.
- !dumpheap –type <TYPE> –> Output the instances of the given type in the heap.
- !dumpobj <address> –> Output the object at the given address.
- !gcroot <address> –> Output the root of the object at the given address.
- !threads –> List the clr threads.
- ~<ThreadNumber>s –> Switch to the given thread number.
- kc –> Output the native stack.
- kb –> Output the native stack including the arguments to the methods.
- !clrstack –> Output the managed stack.
A short overview of how memory management works on .NET
In short .NET memory management works by registering internally the objects that are allocated at the application roots:
- The global and static object pointers in an application.
- Any local variable/parameter object pointers on a thread's stack.
- Any CPU registers containing pointers to objects in the managed heap.
Once these objects are known their children are transverse to build a graph with the reachable objects. If an object is not reachable then it is garbish an must be collected.
When an object is to be collected it first waits in a finalization queue. The finalization code runs in a separated thread called the finalizer thread. The actual process is a bit more complicated but there are very good articles on this topic:
Garbage Collection: Automatic Memory Management in the Microsoft .NET Framework
Garbage Collection - Part 2: Automatic Memory Management in the Microsoft .NET Framework
Detecting the leak
When I am analyzing a memory leak I first try to identify what is the operation causing the leak. This is done by observing the process memory behavior using task manager, performance counters or any other way of observing the memory usage of a process. The bigger the leak the easier it is to spot. Once the operation causing the leak is found things get simpler.
Before executing that operation I break the process and run:
!dumpheap –stat to see what objects are in the heap.
I them execute the operation and repeat the command. There will be an increase in the number of objects and memory in some of the listed objects. After repeating the process a couple of times one will find a pattern and some suspects.
I select of those suspects, maybe the one causing the biggest increase in memory and use:
!dumpheap –type <object type>
This will list all the objects of that type in the heap. After this one can use the:
!objdump <address>
This will output the object content. The contents can point to the place in the code where these objects are coming from. There is another command that is very usefull to determine that:
!gcroot <address>
This will output the stack of the root of the object.The root will point to the place in the code where the object was created. It does not point to the exact line of code but to the class and method. One must look at the code and figure out the exact point.
Them comes asking if that object should still be in memory or if it should have been collected. If it should them there is an object referencing it. To fix the problem one must change the code to make sure that reference is cleared once the object is no longer needed.
One thing that is sometimes useful is to issue:
!threads
And get the number of the thread of the finalizer and them switch to it:
~<ThreadNumber>s
Finalize issue:
!clrstack
And get the stack where the thread is. If you have a long finalize queue maybe the thread is doing something he should not and you might find there a class finalizer doing things that should not be done on finalizers.


No comments:
Post a Comment